TWAMP (Two-Way Active Measurement Protocol, RFC 5357) measures round-trip delay, jitter, and packet loss between two IP nodes for SLA verification. A sender sends timestamped test packets and a reflector returns them, so OcNOS reports two-way performance without clock synchronization between endpoints. It runs on your OcNOS-powered routers across IP/MPLS networks.
Service providers carry a contractual obligation to deliver specific performance levels: latency, jitter, and packet loss targets defined in SLAs with enterprise and wholesale customers. Meeting these obligations requires more than reactive monitoring. Operators need active measurement tools that continuously probe the network and alert when performance degrades, before customers raise a ticket.
Platform note: TWAMP and TWAMP Light performance measurement run on supported OcNOS hardware platforms and are not available on the x86 OcNOS demo VM. Check platform and release support in the OcNOS Feature Matrix.
TWAMP (Two-Way Active Measurement Protocol, RFC 5357) provides exactly this. It sends test packets between two network nodes and measures round-trip delay, one-way delay (with clock synchronization), jitter, and packet loss, all without dedicated hardware probes.
TWAMP Architecture
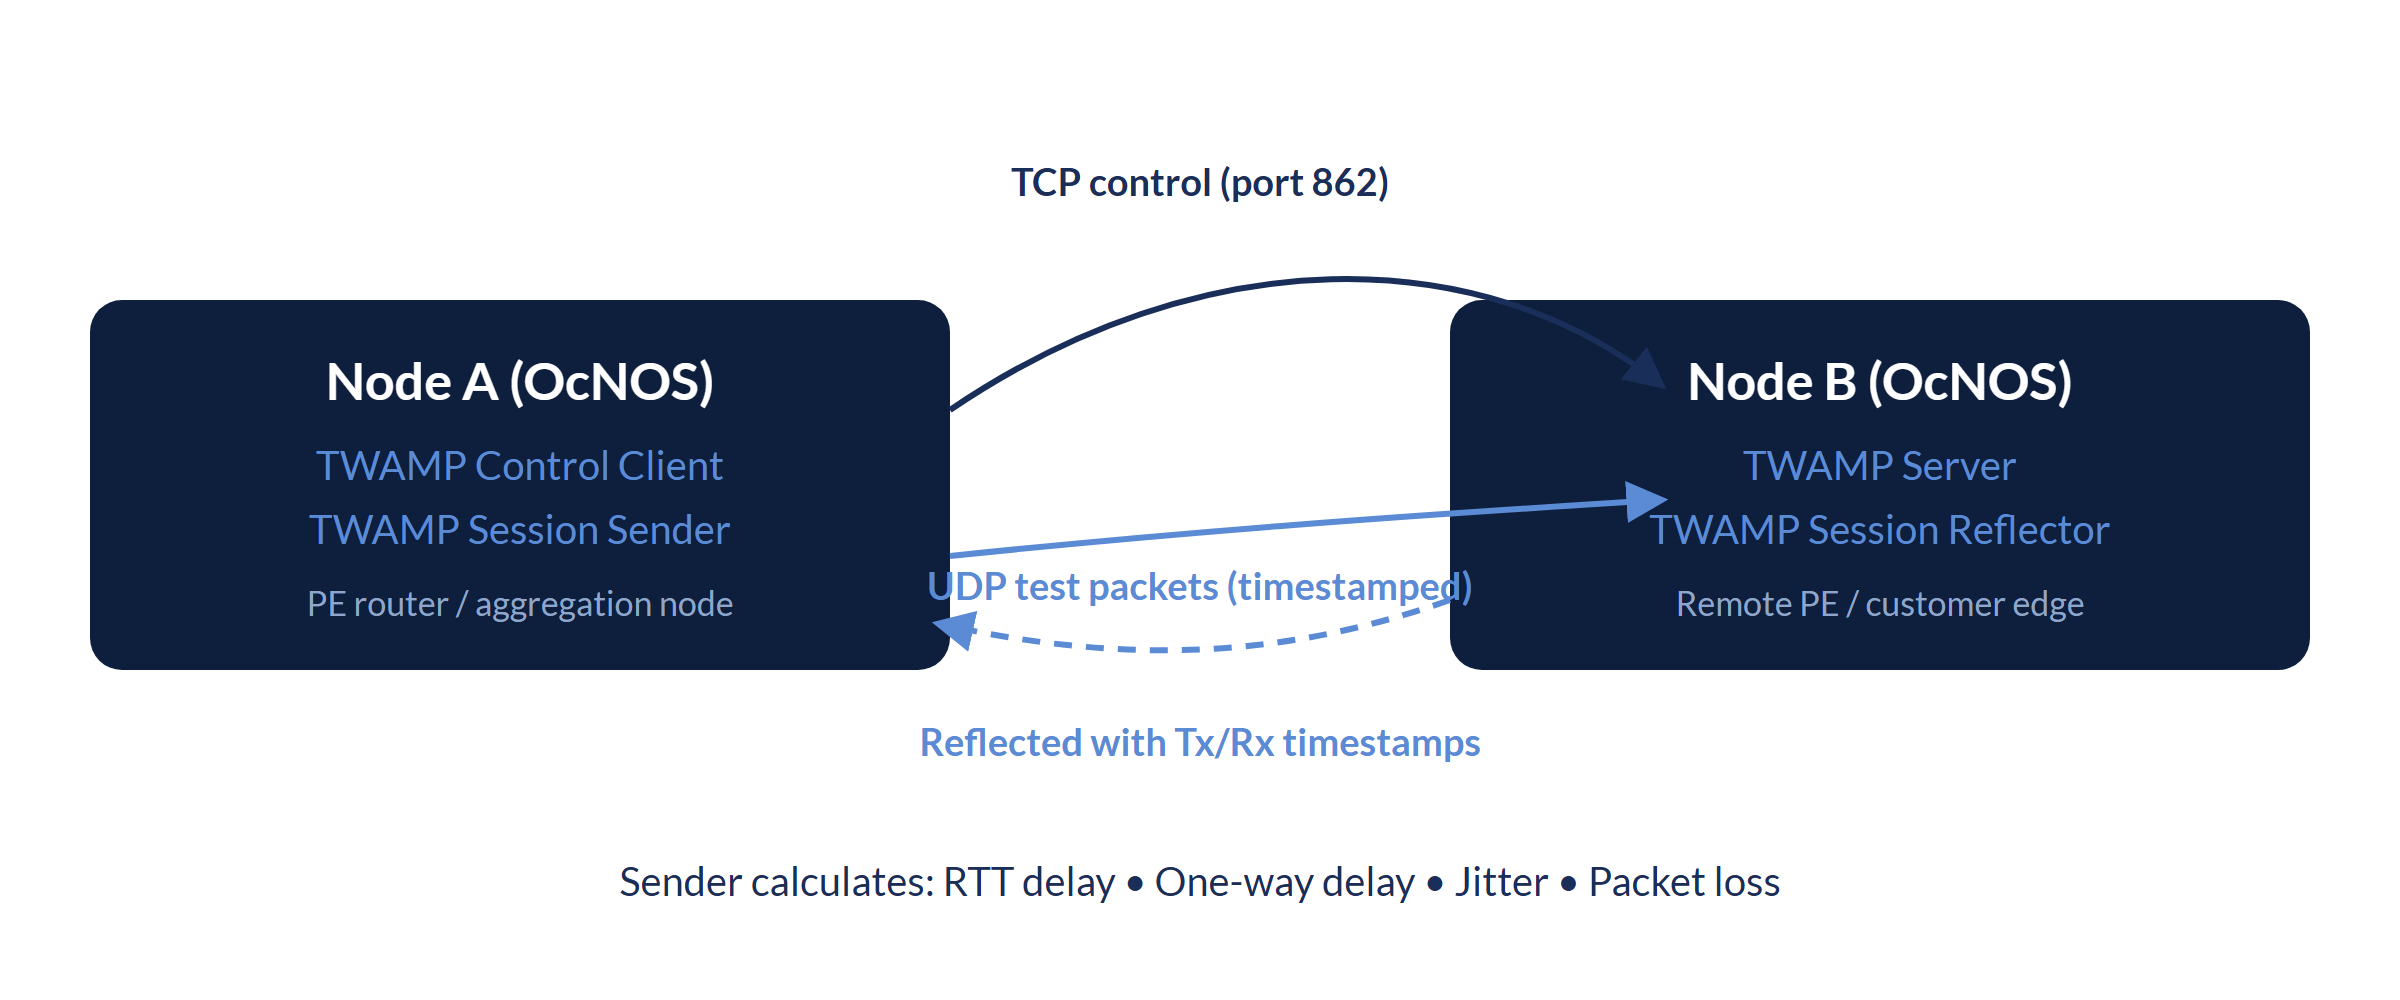
TWAMP defines two planes and four logical roles:
- Control plane (TWAMP-Control): a Control-Client and Control-Server negotiate and manage test sessions over TCP, using the standard control port 862.
- Measurement plane (TWAMP-Test): a Session-Sender transmits timestamped test packets over UDP to a Session-Reflector, which echoes them back with its own timestamps. The Session-Sender then computes round-trip delay, packet loss, and jitter.
Full TWAMP and TWAMP Light
Full TWAMP uses a control connection and a test session. The Control-Client sets up the test session with the Server over TWAMP-Control on TCP port 862. TWAMP Light, described in Appendix I of RFC 5357, omits TWAMP-Control: the Session-Sender and Session-Reflector are configured at each endpoint, so no control-session negotiation is needed before testing. This suits router-to-router SLA probes inside one operator’s network, where both endpoints are under the same management.
OcNOS supports both modes: the Server and Session-Reflector roles, the Control-Client and Session-Sender roles, and TWAMP Light. One-way delay measurement requires synchronized clocks at the two endpoints. The configuration below uses both modes.
TWAMP Configuration in OcNOS
On OcNOS, the responder (Node B) runs the TWAMP server, and the initiator (Node A) drives measurement through TWAMP-Light. The server listens on the standard TWAMP control port:
! OcNOS: TWAMP server (Node B: accepts control sessions)
twamp server
port 862 ! Standard TWAMP control port (RFC 5357)The reflector and the control/sender side use the TWAMP-Light command structure. Addresses, names, and ports below are illustrative placeholders:
! OcNOS: TWAMP-Light reflector (Node B)
twamp-light reflector
 reflector-admin-state enable
 reflector-name <NAME> reflector-ip ipv4 <REFLECTOR-IP> reflector-port <PORT>

! OcNOS: TWAMP-Light control / sender (Node A)
twamp-light control
 control-admin-state enable
 test-session-name <NAME> sender-ip <SENDER-IP> reflector-ip <REFLECTOR-IP>
Alternatively, dynamic TWAMP delay measurement can be enabled directly under an interface:
! OcNOS: interface-based dynamic TWAMP delay measurement (Node A)
interface <IFNAME>
 delay-measurement dynamic twamp reflector-ip <REFLECTOR-IP> reflector-port <PORT> sender-ip <SENDER-IP> sender-port <PORT>
Verifying a TWAMP Session
Once a session is running, the sender reports round-trip, forward, and reverse delay statistics. The following output is from an OcNOS device with PTP synchronized between both nodes:
7012#sh twamp-statistics
========================================
     TWAMP Test-Session Statistics
========================================
 Test-Session Name         : __internal_interface_ge1
 Start Time                : 2023 Sep 28 21:36:11
 Elapsed time(milli sec)   : 15009
 Packets Sent              : 15
 Packets Received          : 15
 Packet Loss(%)            : 0.00
 Round Trip Delay(usec)
     Minimum               : 9
     Maximum               : 10
     Average               : 9
 Forward Delay(usec)
     Minimum               : 4
     Maximum               : 5
     Average               : 4
 Reverse Delay(usec)
     Minimum               : 5
     Maximum               : 5
     Average               : 5
 Round Trip Delay Variation(usec)
     Minimum               : 9
     Maximum               : 9
     Average               : 9
 Forward Delay Variation(usec)
     Minimum               : 4
     Maximum               : 4
     Average               : 4
 Reverse Delay Variation(usec)
     Minimum               : 5
     Maximum               : 5
     Average               : 5
In OcNOS, TWAMP is supported for regular L3, L3VPN over MPLS/SR transport, and EVPN-L3VPN over MPLS/SR transport. For exact platform and release coverage, refer to the OcNOS Feature Matrix and the Service Provider config guides.
TWAMP is one part of the SLA toolkit in OcNOS. For how it works alongside Y.1564 service activation testing and Y.1731 Ethernet OAM, see the TWAMP, Y.1564 and Y.1731 overview.
- Performance Measurement: Y.1731 and Y.1564
- Flex-Algo with Link Delay Metric
- OcNOS-SP Product Page
- Contact IP Infusion
IP Infusion Engineering Team
Go deeper. Take it with you.
Two short, technical downloads that go further than this page: the full OcNOS-SP datasheet and the Cloud & SP WAN transport brief.
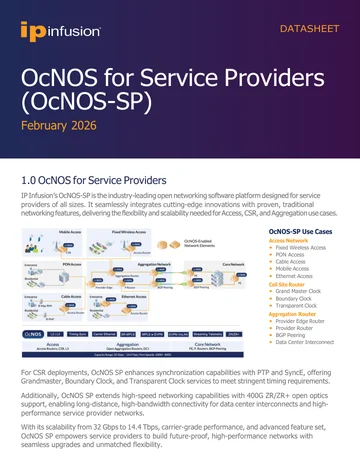
OcNOS-SP Datasheet
Full OcNOS-SP specification: the access, cell site and aggregation feature set, software SKUs, supported hardware platforms, and the solution ordering guide.
Get the datasheet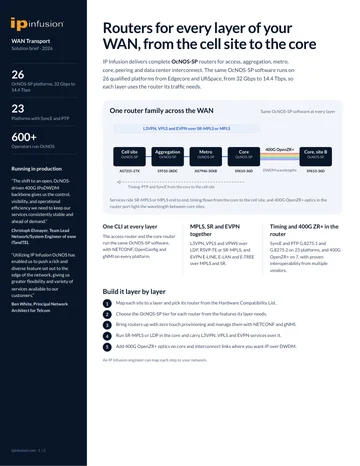
Cloud & Service Provider WAN Transport
Cloud and service-provider WAN transport on open hardware: SR-MPLS, EVPN, and scale-tested forwarding.
Get the briefOcNOS-SP Datasheet
Quick form. Your PDF opens in a new tab immediately after submit.
✓ Opening your PDF in a new tab…
If it didn't open, use the link below.
Cloud & Service Provider WAN Transport
Quick form. Your PDF opens in a new tab immediately after submit.
✓ Opening your PDF in a new tab…
If it didn't open, use the link below.