Service providers carry a contractual obligation to deliver specific performance levels: latency, jitter, and packet loss targets defined in SLAs with enterprise and wholesale customers. Meeting these obligations requires more than reactive monitoring. Operators need active measurement tools that continuously probe the network and alert when performance degrades, before customers raise a ticket.
Platform note: TWAMP and TWAMP Light performance measurement run on supported OcNOS hardware platforms and are not available on the x86 OcNOS demo VM. Check platform and release support in the OcNOS 功能矩陣.
TWAMP (Two-Way Active Measurement Protocol, RFC 5357) provides exactly this. It sends test packets between two network nodes and measures round-trip delay, one-way delay (with clock synchronization), jitter, and packet loss, all without dedicated hardware probes.
TWAMP Architecture
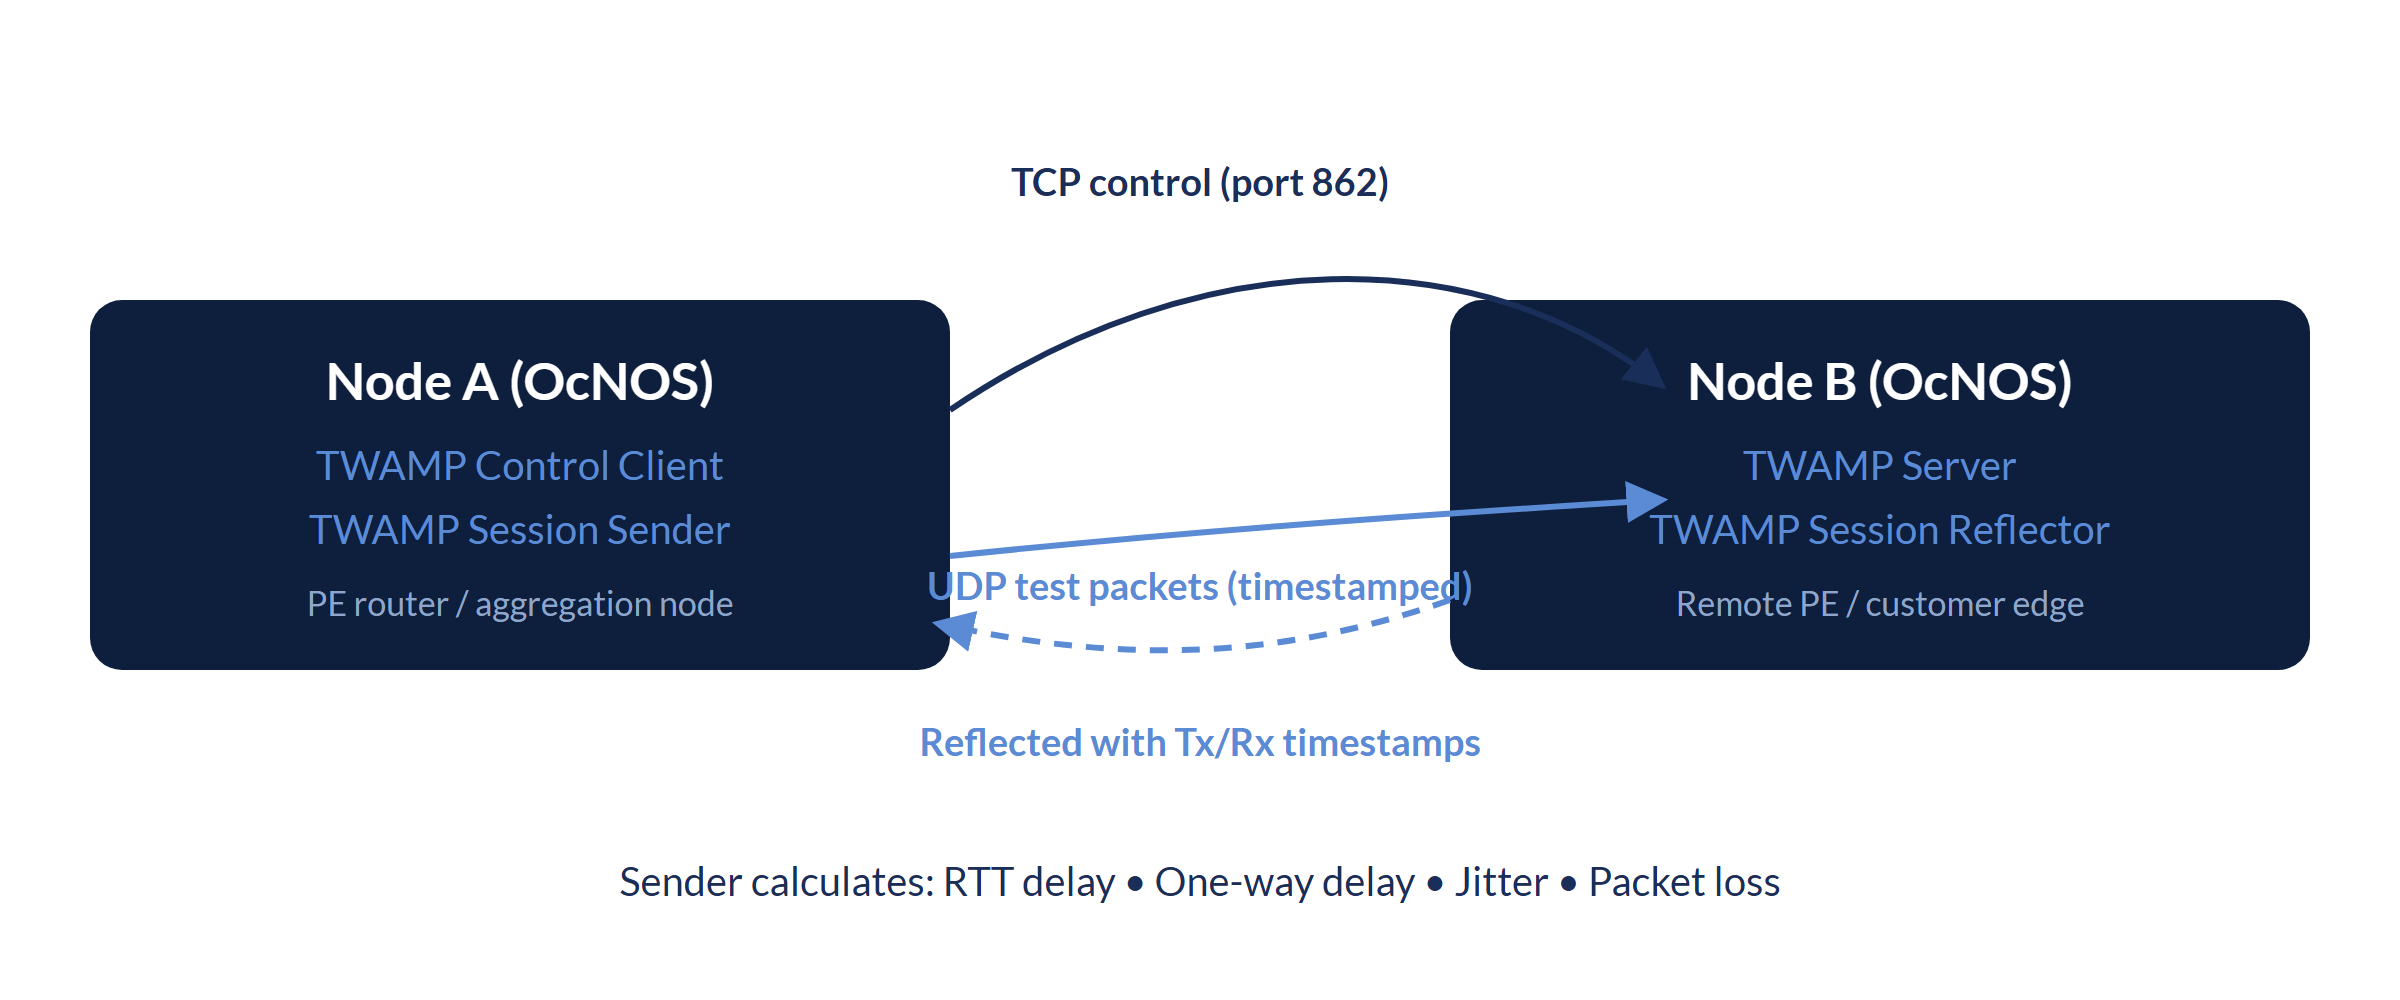
TWAMP defines two planes and four logical roles:
- Control plane (TWAMP-Control): a Control-Client and Control-Server negotiate and manage test sessions over TCP, using the standard control port 862.
- Measurement plane (TWAMP-Test): a Session-Sender transmits timestamped test packets over UDP to a Session-Reflector, which echoes them back with its own timestamps. The Session-Sender then computes round-trip delay, packet loss, and jitter.
TWAMP Configuration in OcNOS
On OcNOS, the responder (Node B) runs the TWAMP server, and the initiator (Node A) drives measurement through TWAMP-Light. The server listens on the standard TWAMP control port:
! OcNOS: TWAMP server (Node B: accepts control sessions)
twamp server
port 862 ! Standard TWAMP control port (RFC 5357)The reflector and the control/sender side use the TWAMP-Light command structure. Addresses, names, and ports below are illustrative placeholders:
! OcNOS: TWAMP-Light reflector (Node B)
twamp-light reflector
 reflector-admin-state enable
 reflector-name <NAME> reflector-ip ipv4 <REFLECTOR-IP> reflector-port <PORT>

! OcNOS: TWAMP-Light control / sender (Node A)
twamp-light control
 control-admin-state enable
 test-session-name <NAME> sender-ip <SENDER-IP> reflector-ip <REFLECTOR-IP>
Alternatively, dynamic TWAMP delay measurement can be enabled directly under an interface:
! OcNOS: interface-based dynamic TWAMP delay measurement (Node A)
interface <IFNAME>
 delay-measurement dynamic twamp reflector-ip <REFLECTOR-IP> reflector-port <PORT> sender-ip <SENDER-IP> sender-port <PORT>
Verifying a TWAMP Session
Once a session is running, the sender reports round-trip, forward, and reverse delay statistics. The following is real output from an OcNOS device with PTP synchronized between both nodes:
7012#sh twamp-statistics
========================================
     TWAMP Test-Session Statistics
========================================
 Test-Session Name         : __internal_interface_ge1
 Start Time                : 2023 Sep 28 21:36:11
 Elapsed time(milli sec)   : 15009
 Packets Sent              : 15
 Packets Received          : 15
 Packet Loss(%)            : 0.00
 Round Trip Delay(usec)
     Minimum               : 9
     Maximum               : 10
     Average               : 9
 Forward Delay(usec)
     Minimum               : 4
     Maximum               : 5
     Average               : 4
 Reverse Delay(usec)
     Minimum               : 5
     Maximum               : 5
     Average               : 5
 Round Trip Delay Variation(usec)
     Minimum               : 9
     Maximum               : 9
     Average               : 9
 Forward Delay Variation(usec)
     Minimum               : 4
     Maximum               : 4
     Average               : 4
 Reverse Delay Variation(usec)
     Minimum               : 5
     Maximum               : 5
     Average               : 5
In OcNOS, TWAMP is supported for regular L3, L3VPN over MPLS/SR transport, and EVPN-L3VPN over MPLS/SR transport. For exact platform and release coverage, refer to the OcNOS Feature Matrix and the Service Provider config guides.
- Performance Measurement: Y.1731 and Y.1564
- Flex-Algo with Link Delay Metric
- OcNOS-SP Product Page
- 聯繫 IP Infusion
IP Infusion Engineering Team
深入了解,隨身帶走。
兩份簡明的技術下載資料,內容比本頁更為深入:完整的 OcNOS-SP 規格書與 Cloud & SP WAN 傳輸簡報。
雲與服務提供商 WAN 傳輸
表單簡短。提交後您的 PDF 將立即在新標籤頁中打開。
✓ 正在新標籤頁中打開您的 PDF……
如果未能自動打開,請使用下方連結。