Streaming Telemetry: gNMI, OpenConfig, gRPC
SNMP polling at 60-second intervals misses microbursts and loads the control plane. OcNOS streams model-driven telemetry over gRPC instead: OpenConfig-modelled paths, on-change or sampled, to a collector that dials in or that the router dials out to, feeding Prometheus, InfluxDB, and Grafana without a translation layer.
Telemetry Pipeline
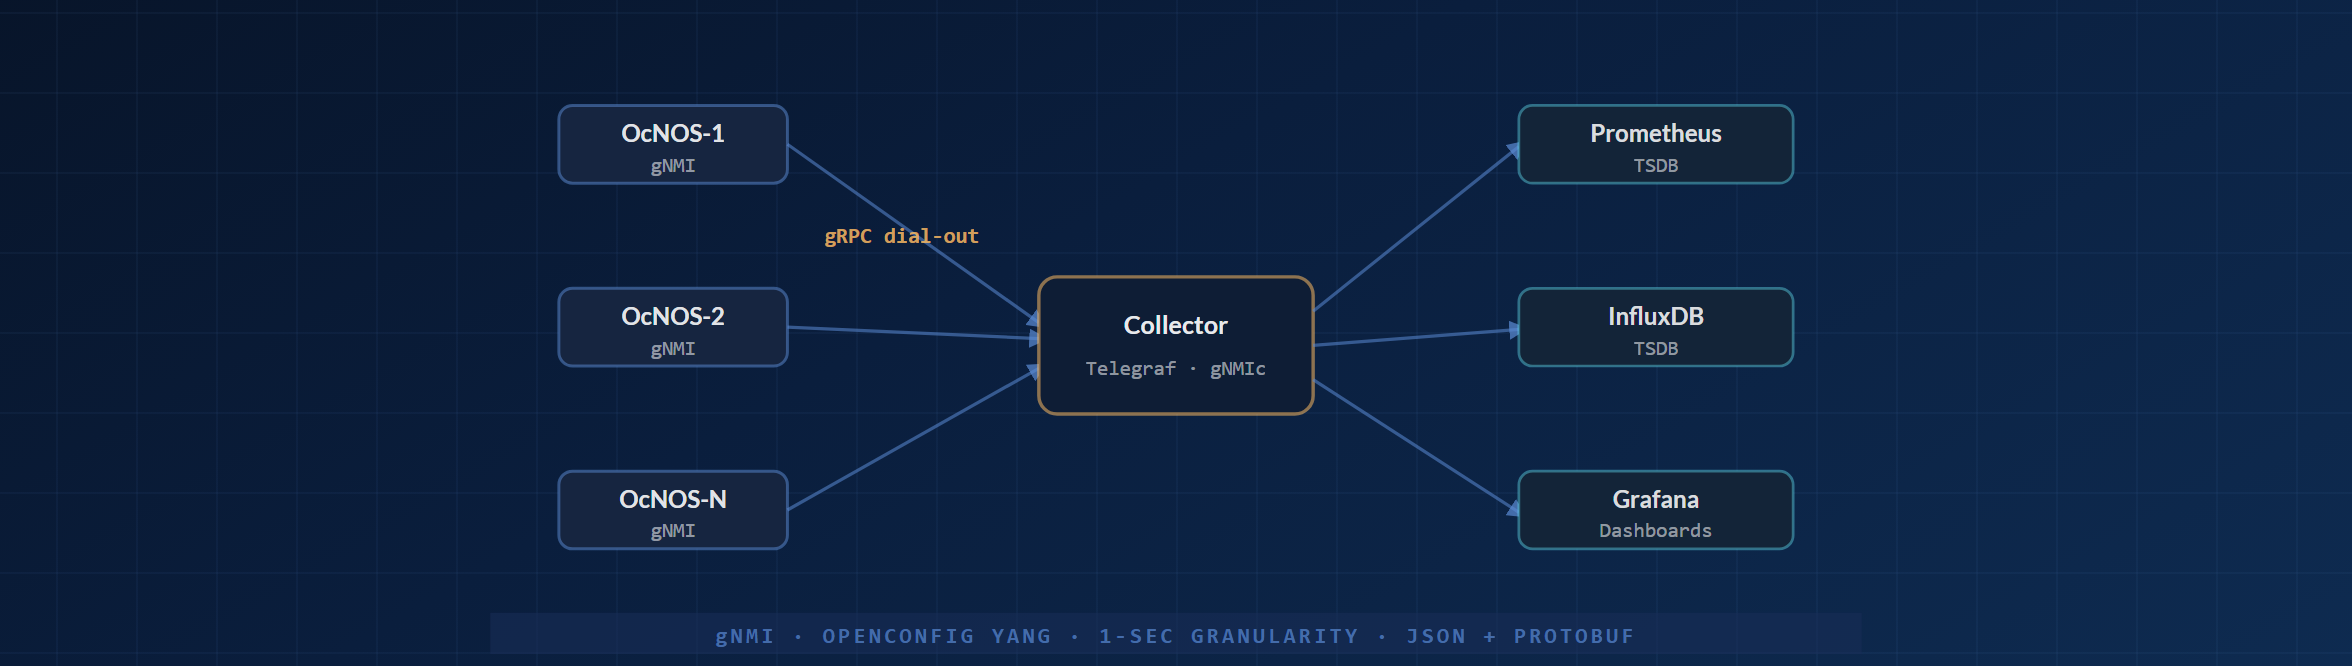
OcNOS routers stream gNMI Subscribe payloads (gRPC dial-out) to a central collector. The collector demuxes into time-series and search backends, and Grafana renders the dashboards on top.
Why streaming telemetry replaced SNMP
SNMP poll cycles miss microbursts, hammer the control plane, and can't deliver a structured, model-driven payload. gNMI Subscribe over gRPC inverts the model: the device pushes typed updates on change or on a sample interval, the collector simply parses the protobuf. OcNOS exposes OpenConfig and IP Infusion native models, and supports both dial-in (collector connects to device) and dial-out (device connects to collector behind NAT) deployments.
The OcNOS streaming telemetry implementation
Stream, once, and poll
Subscribe RPC in stream, once, and poll modes. Sampled streaming since OcNOS 6.5.1, on-change streaming since 7.0.0, so a collector can take a periodic feed or only the deltas.
Behind-NAT routers
gRPC dial-out lets cell-site and edge routers behind NAT push telemetry to a central collector, with no inbound port-opening required.
Path-addressed state
Interface counters, routing state, and platform health are addressed by YANG path. Wild-card keys in the sensor path (since 6.6.0) select every interface or neighbour in one subscription.
Telegraf + gNMIc
gNMI is an open specification, so standard collectors such as the Telegraf gNMI input and gNMIc consume the OcNOS stream and hand it to Prometheus, InfluxDB, and Grafana.
The gNMI RPC surface in OcNOS
gNMI is a small gRPC service with four RPCs: Capabilities, Get, Set, and Subscribe. Telemetry is the Subscribe RPC. The table lists what OcNOS implements and the release that introduced it, as recorded in the Feature Matrix.
Subscribe, dial-in
The collector opens the gRPC session to the router over IPv4 or IPv6 and subscribes to paths. gNMI specification 0.10.0.
Since OcNOS 6.4.1
Subscribe, dial-out
The router opens the session to the collector through a gRPC tunnel, so routers behind NAT or a firewall need no inbound port.
Since OcNOS 6.5.1
Once and poll modes
A one-shot snapshot of the subscribed paths, or a subscription the collector polls on its own schedule, alongside continuous streaming.
Since OcNOS 6.5.1
On-change streaming
Updates only when a value changes, for state such as interface operational status, BGP session state, and route counts.
Since OcNOS 7.0.0
Get RPC and wild-card paths
Point reads through gNMI Get, and wild-card keys in the sensor path so one subscription covers every interface or every neighbour.
Since OcNOS 6.6.0
TLS, authentication, in-band
TLS on the gRPC session, user authentication on the gNMI server (since 7.0.0), and in-band operation in one or several VRFs.
Since OcNOS 6.6.0
OpenConfig models
OpenConfig data models over gNMI, with OpenConfig support in the NETCONF path since 6.0.0, so the same model tree serves configuration and telemetry.
Since OcNOS 6.5.1
What you get with OcNOS telemetry
- Standards-aligned paths. OpenConfig leaf paths match what your existing collector already expects, with no proprietary YANG translation layer.
- Change-driven visibility. On-change subscriptions report a state transition when it happens, not at the next poll, and sampled subscriptions run at the interval the collector asks for.
- Open collector stack. Standard gNMI collectors, Prometheus, InfluxDB, and Grafana work as they do for any other gNMI source.
Modernizing your observability stack?
Request a Technical Demo →Frequently asked questions
What is the difference between streaming telemetry and SNMP?
What gNMI subscription modes does OcNOS support?
Can OcNOS stream telemetry from routers behind NAT?
What data can gNMI stream from OcNOS?
Which collectors work with OcNOS telemetry?
Go deeper. Take it with you.
Two short, technical downloads that go further than this page: the full OcNOS-SP datasheet and the full OcNOS-DC datasheet.
OcNOS-SP Datasheet
Full OcNOS-SP specification: the access, cell site and aggregation feature set, software SKUs, supported hardware platforms, and the solution ordering guide.
Get the datasheetOcNOS-DC Datasheet
Full OcNOS-DC specification: the EVPN-VXLAN and Ethernet for AI feature set, software SKUs, supported hardware platforms, and the solution ordering guide.
Get the datasheetOcNOS-SP Datasheet
Quick form. Your PDF opens in a new tab immediately after submit.
✓ Opening your PDF in a new tab…
If it didn't open, use the link below.
OcNOS-DC Datasheet
Quick form. Your PDF opens in a new tab immediately after submit.
✓ Opening your PDF in a new tab…
If it didn't open, use the link below.