Simple Network Management Protocol (SNMP) was designed in 1988 for networks that carried kilobits of traffic per second. It works by polling: a management system asks a device for its current state, the device responds, and the cycle repeats every 60 to 300 seconds. For the networks SNMP was designed for, this was adequate.
For a modern AI data center where a single link can move 800 gigabits per second, or a service provider network carrying real-time 5G traffic, SNMP polling is not just inadequate. It actively masks the network behavior that operators need to observe.
The Fundamental Problem with Polling

Why SNMP Fails in AI and High-Speed Networks
- Polling granularity. Even aggressive 1-minute SNMP polling misses events that last seconds. Queue fills and drains in under 100ms in 800G fabrics.
- CPU overhead. Each SNMP poll request consumes CPU cycles on the network device. At scale, polling hundreds of interfaces creates a predictable CPU spike every cycle.
- No event semantics. SNMP tells you the state at polling time. It does not tell you what changed, when it changed, or what caused it.
- No view between polls. SNMP reports a counter only at the instant you poll it. Even with 64-bit counters that never wrap, you get the running total, never the transient that formed and cleared in the gap between two polls.
- AI fabric specific. PFC pause frame storms, ECN marking events, and RoCEv2 retransmission bursts are transient and invisible to SNMP polling.
gNMI Streaming Telemetry: How It Works
gNMI (gRPC Network Management Interface) inverts the monitoring model. Instead of the management system asking the device for data, the device pushes data to the collector. In the gNMI Subscribe RPC, two subscription modes are available:
- On-Change. Data is pushed only when the value changes. A link going down triggers an immediate push. Ideal for state changes (interface status, BGP session state, route table changes). On-change is typically requested by the collector in dial-in mode using the gNMI Subscribe RPC.
- Sample. Data is pushed at a configured interval. Used for counters and metrics where absolute values at regular intervals are needed (queue depth, byte counters).
Configuring gNMI Streaming Telemetry in OcNOS
OcNOS configures streaming telemetry from four separate building blocks: the feature is enabled globally, then a sensor-group lists the paths to stream, a destination-group names the collector, and a subscription-name binds them together. This example shows dial-out mode, where OcNOS opens the gRPC tunnel to the collector and streams at the configured sample interval.
! OcNOS streaming telemetry (dial-out) configuration
!
! 1. Enable the feature (enters feature-telemetry config mode)
feature streaming-telemetry
!
! 2. Define a sensor-group and the OpenConfig paths to stream
sensor-group INTF-STATS
 sensor-path /interfaces/interface[name="xe1"]/state/counters
 sensor-path /interfaces/interface[name="xe1"]/state/oper-status
!
! 3. Define a destination-group (the collector / tunnel server)
destination-group COLLECTOR-1
 tunnel-server ip 10.12.101.72 port 11161
!
! 4. Bind sensor-group and destination-group in a named subscription
subscription-name INTERFACE-STATS
 encoding json-ietf
 destination-group COLLECTOR-1
sensor-group INTF-STATS sample-interval 10 ! seconds; valid range 10-3600The sample interval is expressed in seconds, with a valid range of 10 to 3600. Encoding is json-ietf (lowercase); json und proto are also supported. The exact sensor paths available depend on the YANG models supported in your OcNOS release; confirm them against the OcNOS streaming telemetry documentation before deployment.
OpenConfig and IPI-Native YANG Models
A single sensor-group can mix vendor-neutral OpenConfig paths with IPI-native paths. OpenConfig paths are standardized across vendors, so the same collector configuration works across OcNOS and other OpenConfig-capable platforms.
! OpenConfig and IPI-native paths in the same sensor-group
!
sensor-group MIXED-MODELS
 ! OpenConfig path (vendor-neutral)
 sensor-path /interfaces/interface[name="xe1"]/state/counters
 ! IPI-native path
 sensor-path ipi:/components/component[name=RAM]/ram/state
!
! Verify configuration and subscription state:
show running-config streaming-telemetry
show streaming-telemetry persistent-subscriptions brief
show streaming-telemetry persistent-subscriptions details
Migration Path: SNMP to gNMI
| Step | Action | Hinweise |
|---|---|---|
| 1 | Deploy gNMI collector (Prometheus + gNMI Exporter, InfluxDB, or commercial) | Run in parallel with SNMP initially |
| 2 | Configure OcNOS gNMI subscriptions for key sensors | Start with interface state and BGP events |
| 3 | Validate data completeness against SNMP baselines | 2 to 4 week parallel run |
| 4 | Expand to queue, PFC, and optical sensors | These are invisible to SNMP anyway |
| 5 | Decommission SNMP polling for covered sensors | Keep SNMP only for legacy devices that lack gNMI |
- Automating Network Deployments with OcNOS
- Performance Measurement: TWAMP and Y.1731
- OcNOS 7.0 SP: On-Change gNMI Telemetry
- IP Maestro: Element Management for OcNOS
- IP Infusion kontaktieren
IP Infusion Engineering Team
Tiefer einsteigen. Zum Mitnehmen.
Zwei kurze, technische Downloads, die über diese Seite hinausgehen: das vollständige OcNOS-SP-Datenblatt und das vollständige OcNOS-DC-Datenblatt.
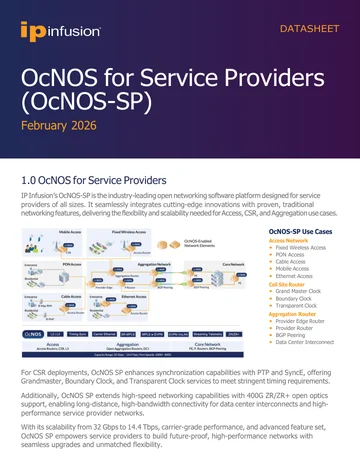
OcNOS-SP-Datenblatt
Vollständige OcNOS-SP-Spezifikation: Funktionsumfang für Access, Cell Site und Aggregation, Software-SKUs, unterstützte Hardware-Plattformen und der Solution Ordering Guide.
Datenblatt abrufen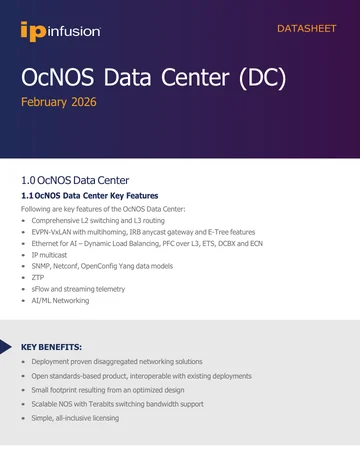
OcNOS-DC-Datenblatt
Vollständige OcNOS-DC-Spezifikation: Funktionsumfang für EVPN-VXLAN und Ethernet for AI, Software-SKUs, unterstützte Hardware-Plattformen und der Solution Ordering Guide.
Datenblatt abrufenOcNOS-SP-Datenblatt
Kurzes Formular. Ihr PDF öffnet sich unmittelbar nach dem Absenden in einem neuen Tab.
✓ Ihr PDF wird in einem neuen Tab geöffnet…
Falls es sich nicht geöffnet hat, nutzen Sie den untenstehenden Link.
OcNOS-DC-Datenblatt
Kurzes Formular. Ihr PDF öffnet sich unmittelbar nach dem Absenden in einem neuen Tab.
✓ Ihr PDF wird in einem neuen Tab geöffnet…
Falls es sich nicht geöffnet hat, nutzen Sie den untenstehenden Link.